OEE Calculator
An easy-to-use online OEE calculator that includes the formulas for availability, quality, performance and OEE. Easily calculate OEE and improve performance in your Industry.
What is OEE?
Overall Equipment Effectiveness (OEE) is a key performance indicator used to measure the efficiency and productivity of a manufacturing process. It provides valuable insights into how well equipment is performing in terms of availability, performance, and quality. OEE is expressed as a percentage, with higher percentages indicating better overall equipment effectiveness.
Components of OEE
How to Calculate OEE?
The Three Components of OEE (Overall Equipment Effectiveness) Calculation. OEE is a pivotal metric in manufacturing, measuring the effectiveness of equipment. It monitors how much time is productive and where to make improvements. To calculate the OEE formula, you must multiply OEE’s 3 components: Availability, performance, and quality. For an OEE calculation, you need these 3 formulas:
OEE Calculator
The Importance of OEE:
Availability – OEE Calculation

Availability is essentially the time that your machines are actually working, as a percentage of scheduled working time.
To find equipment/machine availability, divide the working time by the total scheduled time for that period. Then, multiply the result by 100 to show it as a percentage.

Performance – OEE Calculation
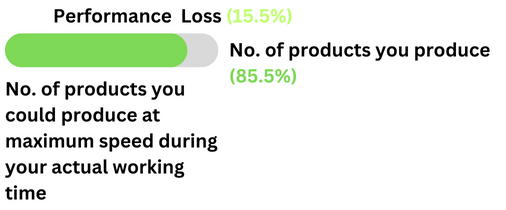
To calculate performance, you need to find out how many products you produce, and how it compares to the number of products that you could produce at maximum speed during your actual (not all scheduled, but actual) working time.
The formula of the Performance component of OEE is:

How do you find out your maximum production speed?
Sometimes, the manufacturer of the machine specifies it (it might also be called “nameplate” or “ideal cycle time”). If not, you can identify the fastest recorded time. Firstly, look at the machines’ performance history. Next, calculate how many products you would make if your machine ran at that speed.
If you don’t have this data, we highly recommend implementing an OEE system that does these calculations for you and gives you the data you need to manage OEE effectively.
Quality – OEE Calculation

Simply put, quality shows the portion of good products among all products.
The formula for Quality is:

OEE Calculation
If you multiply all OEE Components with each other, you will get the OEE value.

Application Templates
Pre-made Industry 4.0 templates
Pre-made application templates on IoTdashboard Industrial IoT Platform ensure your fast and secure transition to Industry 4.0.
Questions and answers about OEE (Overall Equipment Effectiveness)
Overall Equipment Effectiveness (OEE) is a key performance indicator used to assess and improve the efficiency of manufacturing processes. It combines three factors – Availability, Performance, and Quality – to provide a comprehensive view of equipment performance. By analyzing OEE, businesses can identify and address factors causing downtime, performance losses, and defects, ultimately leading to enhanced overall efficiency.
In the era of Industry 4.0, characterized by the integration of digital technologies into manufacturing, OEE plays a pivotal role. OEE aligns with the principles of smart manufacturing, providing real-time insights into production processes. With Industry 4.0 technologies like IoT and data analytics, OEE data becomes actionable, enabling predictive maintenance, condition monitoring, and continuous improvement, driving manufacturing efficiency to new heights.
Implementing OEE brings a myriad of benefits to manufacturing operations. It helps in identifying and eliminating sources of inefficiency, reducing downtime, improving overall equipment performance, and enhancing product quality. OEE empowers decision-makers with data-driven insights, fostering a culture of continuous improvement and enabling proactive management of production processes.
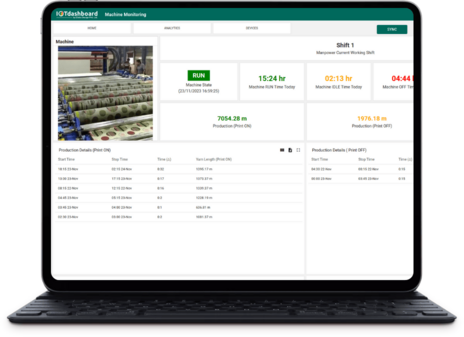
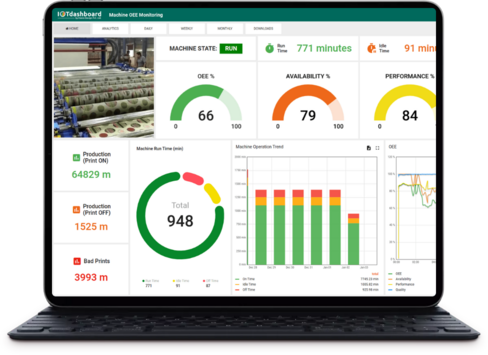
The OEE monitoring dashboard is a comprehensive tool that offers a wealth of performance metrics. It includes real-time values, production details, run time, idle time, and off time. Additionally, it may provide insights into machine utilization, cycle time, and overall equipment effectiveness, offering a holistic view of the production environment to facilitate informed decision-making.
Absolutely. OEE is a versatile metric applicable to a wide range of industries, including manufacturing, pharmaceuticals, automotive, food and beverage, and more. It provides a standardized way to evaluate and improve efficiency, making it universally valuable across diverse manufacturing environments.
The shiftwise dashboard enhances production management by providing granular insights into performance variations during different shifts. It allows for a detailed analysis of production efficiency, downtime patterns, and performance trends across shifts. This information is invaluable for optimizing shift schedules, identifying training needs, and implementing targeted improvements to maximize overall productivity.
Yes, our OEE dashboard offers versatile timeframes, allowing users to analyze data on a shiftwise, daily, weekly, or monthly basis. Additionally, a customizable date range feature through a datepicker empowers users to set specific shifts, days, or weeks for a more detailed and personalized analysis of production performance.
OEE is instrumental in minimizing downtime by identifying the root causes of interruptions in production processes. Through detailed analysis of availability and performance metrics, OEE facilitates proactive maintenance, reducing unplanned downtime. Moreover, by optimizing performance and quality, OEE contributes to maximizing machine utilization, ensuring that manufacturing assets operate at their full potential, driving efficiency and profitability.
Explore the user-friendliness of our OEE monitoring dashboard, emphasizing its intuitive interface tailored for industry professionals. Highlight features that enhance the user experience, such as seamless navigation, interactive visualizations, and the ability to effortlessly access shiftwise, daily, weekly, and monthly data through the datepicker functionality.
