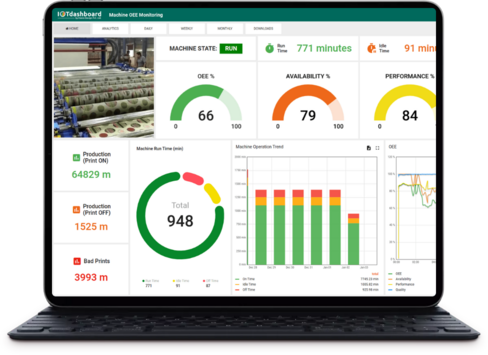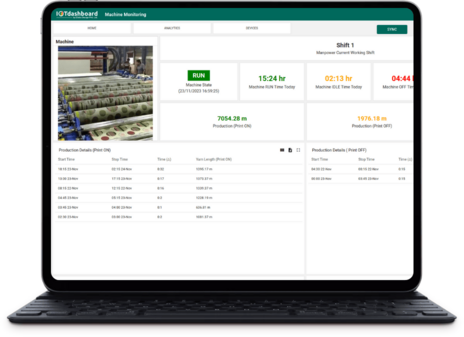

Real-time Performance Tracking
Ensure
continuous
monitoring
of
machine
run
time,
idle
time,
and
stop
time,
enabling
swift
responses
to
dynamic
production
needs
and
optimizing
overall
operational
performance.

Shift-Specific Analysis
Focus
on
the
current
shift's
data
to
gain
insights
into
machine
performance
during
specific
operational
hours.

Production Optimization
Optimize
production
by
monitoring
production
during
run
and
idle
times
separately,
facilitating
better
planning.

Immediate State Recognition
Instantly
recognize
the
machine's
current
state—whether
it's
running,
idle,
or
stopped—for
quick
decision-making.

Graphical Trend Representation
Use
graphs
and
trend
data
to
visually
represent
machine
performance
trends,
aiding
in
the
analysis
of
historical
data.